ApacheBench (ab) is a very handy webserver benchmarking tool which can be run from command line. It is extremely simple to use. A quick outcome can be obtained in just one minute. It does not require too much much familiarity with load and performance testing concepts. No complex setup is required. It gets installed automatically with apache. It does not have all the features of more popular tools, but it is good for a start.
Environment for the test
Here is the setup I used:
- OS: Ubuntu server 12.04.1 LTS (LTS stands for Long term support)
- AWS details: Micro instance in california
- Site software: WordPress 3.5.1 with w3 total cache installed (using page cache in memcache)
- Web server: Apache 2.2.2 (prefork)
Running ApacheBench locally on web server machine
Run it on same server as your webserver using this command:
ab -n 500 -c 100 http://yoursite.com/
This will run it for 500 requests in total with 100 current requests. Here are some points to note:
- You can increase the total requests. It should always be more than number of concurrent requests.
- You can also add
-H "Accept-Encoding: gzip,deflate"to more closely emulate real requests. But as we are on same server and there is no network overhead, it will not matter too much. - For such high number of request the test should be done locally or on same LAN (Local Area Network). Otherwise you may get bad results due to network latency and you may think its your server problem. In reality all you concurrent users won’t come from one machine.
- This tests does not emulate the real environment fully. But it is good enough to help you find out most of the major problems in your site.
Testing outcome from ApacheBench
Here is the outcome for above command on my server:
This is ApacheBench, Version 2.3 <$Revision: 655654 $>
Copyright 1996 Adam Twiss, Zeus Technology Ltd, http://www.zeustech.net/
Licensed to The Apache Software Foundation, http://www.apache.org/

Benchmarking infoheap.com (be patient)
Completed 100 requests
Completed 200 requests
Completed 300 requests
Completed 400 requests
Completed 500 requests
Finished 500 requests


Server Software:        Apache/2.2.22
Server Hostname:        infoheap.com
Server Port:            80

Document Path:          /
Document Length:        24359 bytes

Concurrency Level:      100
Time taken for tests:   8.978 seconds
Complete requests:      500
Failed requests:        0
Write errors:           0
Total transferred:      12305000 bytes
HTML transferred:       12179500 bytes
Requests per second:    55.69 [#/sec] (mean)
Time per request:       1795.684 [ms] (mean)
Time per request:       17.957 [ms] (mean, across all concurrent requests)
Transfer rate:          1338.39 [Kbytes/sec] received

Connection Times (ms)
              min  mean[+/-sd] median   max
Connect:        2   18 117.2      3    1001
Processing:    92 1639 475.4   1771    3022
Waiting:       65 1583 455.4   1711    2930
Total:         96 1657 490.0   1780    3025

Percentage of the requests served within a certain time (ms)
  50%   1780
  66%   1866
  75%   1895
  80%   1915
  90%   1973
  95%   2421
  98%   2622
  99%   2654
 100%   3025 (longest request)
Analysis of the ApacheBench load testing output
Here are my observation about the outcome
- Total data transferred is 12305000 bytes for 500 requests. Close to 20K per page (un-compressed). Which is inline with my home page size.
- Test completed in 8.978. No failed requests. Very good number I think.
- Requests per seconds: 55.69. Pretty good number.
- Time per request: 1795.684 milli-seconds (for 100 concurrent requests). So across all requests it is 1795.684ms/100 = 17.957ms
- Transfer rate: 1338.39 [Kbytes/sec] received. Since we ran the test on same machine, this number was expected to be high and can be ignored.
- In connection time stats, you can see many requests had to wait for few seconds. This may be due to apache putting requests in wait queue.
Overall test results are good. This test does not really tested the network latency. But it primarily tested if 100 concurrent requests reached to the web server, how does it perform.
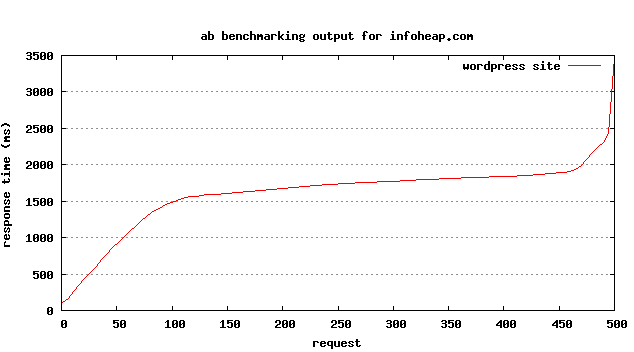
Plotting the outcome of ApacheBench
I generated the graph data for plotting using this command:
ab -n 500 -c 100 -g out.data http://yoursite.com/
And then plotted it using gnuplot. Here is the outcome.
