InfoHeap
Tech
Navigation
  • Home
  • Tutorials
    • CSS tutorials & examples
    • CSS properties
    • Javascript cookbook
    • Linux/Unix Command Line
    • Mac
    • PHP
      • PHP functions online
      • PHP regex
    • WordPress
  • Online Tools
    • Text utilities
    • Online Lint Tools
search

Wordpress How-Tos

  • angularjs in wordpress
  • Convert wordpress page to posts and vice versa
  • Find all user created wordpress custom field keys
  • How to automate wordpress sandbox setup on Linux
  • How to capture php code or included file output in a variable
  • How to check the performance of a plugin using mysql query log
  • How to migrate wordpress from root to sub directory
  • How to upgrade wordpress manually
  • How to view wordpress current version
  • Setup xdebug for remote wordpress debugging
  • Wordpress - disable theme and plugin editing
  • Wordpress - get wpdb class method names
  • Wordpress multisite network vs normal installation
  • display method names from php WP_Query object
  • find if a wordpress page is leaf page
 
  • Home
  • > Tutorials
  • > Wordpress
  • > Wordpress How To

Setup xdebug for remote wordpress debugging

By admin on Oct 2, 2015

Using xdebug is pretty useful for debugging and sometimes understanding existing code. In a typical setup where wordpress in installed remotely on EC2 or any other cloud, it can be little tricky to make remote debugging work with GUI development tools like eclipse. In this article we’ll setup remote debugging for wordpress installed on Ubuntu Linux and eclipse (Mars 4.5.0) installed on Local Mac.

Install xdebug

First install php extension xdebug on remote Linux machine.

$ sudo pecl install xdebug

Add the following line to your /etc/php.ini file

zend_extension=xdebug.so
xdebug.remote_enable=1
xdebug.remote_handler=dbgp
xdebug.remote_mode=req
xdebug.remote_host=127.0.0.1
xdebug.remote_port=9000

Now restart apache server

$ sudo service apache2 restart

Setup ssh tunnel for port 9000

Assuming you are not using port 9000 for any other purpose on server and client machines, run the following command to setup tunnel:

ssh user@remove-machine -R9000:127.0.0.1:9000

This will ensure that when remote xdebug debugger connects to port 9000 on 127.0.0.1, it gets tunneled to port 9000 on client (Eclipse).

Install pdt plugin

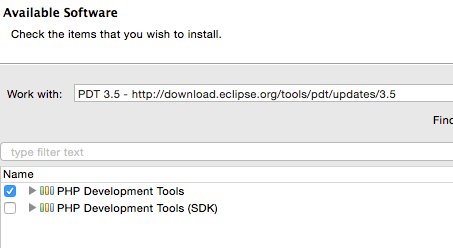
Install latest pdt plugin using the instructions mentioned on pdt eclipse page. This is how install new software window will look like:
eclipse-pdt-installation-options

Setup eclipse project to debug using xdebug

These are the steps to setup eclipse project for debugging:

  1. Copy the wordpress root folder from remote machine to local mac. This will make sure wordpress source is same on remote and local machine. We need copy of source code on local machine for debugging. Create a php project in eclipse from existing source (wordpress root folder). The create screen should look like this:
    eclipse-new-php-project-from-existing-source

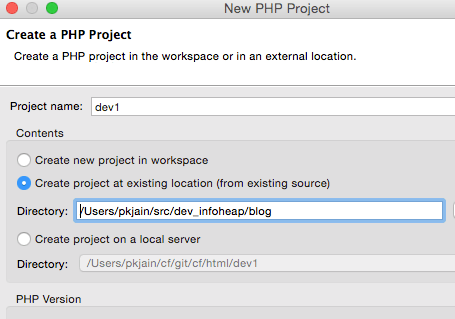
    Here blog folder contains wordpress files like wp-config.php, etc.

  2. With the php project opened, click on “Run” => “Debug Configurations”. Now select “PHP Web applications” in left pane and click on “launch new configuration” icon on top left.
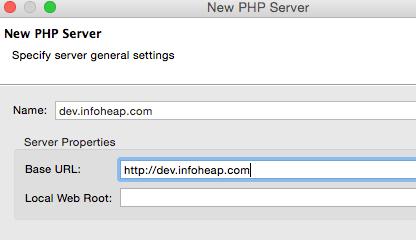
  3. Make sure server tab is selected. Click on new server button and in general setting enter the server details. If you server is dev.infoheap.com then your entries should look like some like this:
    eclipse-php-debug-new-php-server-general-settings
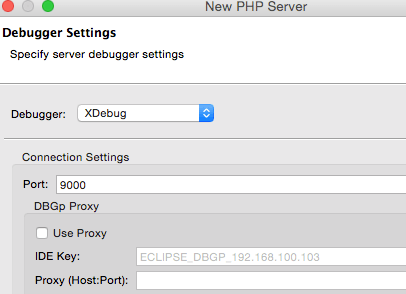
  4. Click next and select XDebug as debugger. Leave the default port as 9000. In case you took a different port earlier for xdebug, you can change it accordingly. Here is how the debugger settings should look like:
    eclipse-php-debug-new-php-server-debugger-settings
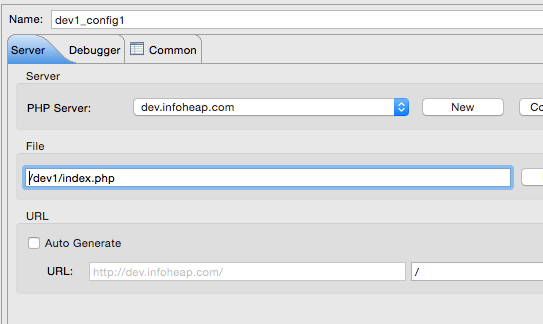
  5. Click finish in debugger settings windows. Now on server tab, select index.php in File box (it should look like /dev1/index.php for a project name dev1). In URL box, uncheck “Auto Generate” and enter / in URL field. The server tab should look something like this:
    eclipse-php-debug-php-debug-configuration-server-tab
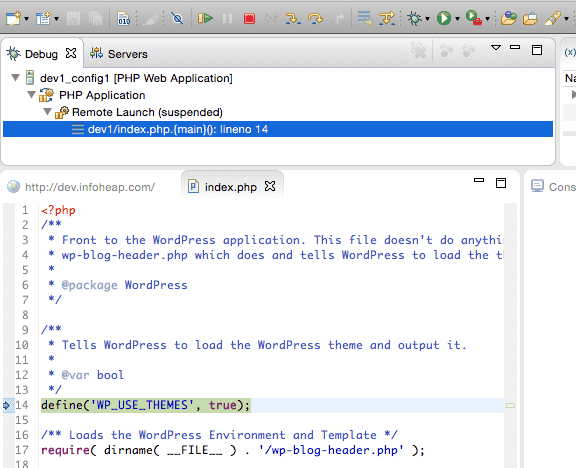
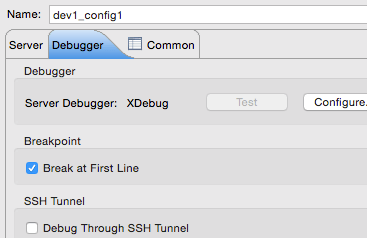
  6. Now click on Debugger tab and check “Break at First Line” as shown below. This way when we start debugging, the debugger will be opened on first line itself.
    eclipse-php-debug-php-debug-configuration-debugger-tab
  7. Now click on debug button to start debugging. If everything works fine, you should debugger getting stopped at first line in index.php as shown below:
    eclipse-php-debug-break-index-php

Suggested posts:

  1. Edit a file without changing its timestamp on Linux
  2. Bash – variables in double quotes vs without quotes
  3. How to migrate wordpress from root to sub directory
  4. How to prevent ssh session freezing due to timeout
  5. Ubuntu – reload iptables rules during boot
  6. Git – how to undo last commit
  7. Jenkins – how to setup build failure email
  8. Handle pagination in wordpress custom php code
Share this article: share on facebook share on linkedin tweet this submit to reddit
Posted in Tutorials | Tagged Linux, Tutorials, Web Development, Wordpress, Wordpress How To
  • Browse content
  • Article Topics
  • Article archives
  • Contact Us
Popular Topics: Android Development | AngularJS | Apache | AWS and EC2 | Bash shell scripting | Chrome developer tools | Company results | CSS | CSS cookbook | CSS properties | CSS Pseudo Classes | CSS selectors | CSS3 | CSS3 flexbox | Devops | Git | HTML | HTML5 | Java | Javascript | Javascript cookbook | Javascript DOM | jQuery | Kubernetes | Linux | Linux/Unix Command Line | Mac | Mac Command Line | Mysql | Networking | Node.js | Online Tools | PHP | PHP cookbook | PHP Regex | Python | Python array | Python cookbook | SEO | Site Performance | SSH | Ubuntu Linux | Web Development | Webmaster | Wordpress | Wordpress customization | Wordpress How To | Wordpress Mysql Queries | InfoHeap Money

Copyright © 2025 InfoHeap.

Powered by WordPress