rrdtool open source tool is used to log time series data and create nice graphs form that data. Official information can be obtained from rrdtool‘s official site. For the purpose of this article I am taking network usage monitoring use case. Netstat can be used to print the outgoing and incoming traffic for an interface. Here are the steps:
Installing rrdtool
rrdtool can be installed on Mac using brew.
$ brew install rrdtool
$ brew list rrdtool
To install it on Ubuntu Linux you can use sudo apt-get install rrdtool.
Create an rrd db file
Next step is to create an rrd file specifying data source. Run the following command:
$ rrdtool create traffic.rrd --step 120 DS:incoming:COUNTER:240:U:U RRA:AVERAGE:0.5:1:60
This will create a Data source traffic of type COUNTER and heartbeat 240 seconds which will expect data at interval of 120 seconds.
RRA (Round robin archives) has a step of 1 and 60 rows stored.
Command to print total network packets
Use netstat to print incoming and outgoing traffic on an interface. Assuming your network interface is en1 on your local computer, run this:
$ netstat -i -I en1
To print incoming traffic:
$ netstat -i -I en1 | awk '{print $5}' | tail -1
Update rrd db
Run the following command to update the db file:
$ netstat -i -I en1 | awk '{print $5}' | tail -1 | xargs -n1 -I % rrdtool update traffic.rrd N:%
Generate graph using rrdtool
Use the following command to generate the graph based on the collected data
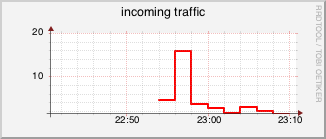
$ rrdtool graph rrdtool_incoming_traffic.png -w 245 -h 80 -a PNG --start -3600 --end now --title "incoming traffic" DEF:incoming=traffic.rrd:incoming:AVERAGE LINE2:incoming#FF0000
Now this should be scheduled as a cron running every 2 min. Here is the image which got generated after few hours.
