InfoHeap
Tech tutorials, tips, tools and more
Navigation
  • Home
  • Tutorials
    • CSS tutorials & examples
    • CSS properties
    • Javascript cookbook
    • Linux/Unix Command Line
    • Mac
    • PHP
      • PHP functions online
      • PHP regex
    • WordPress
  • Online Tools
    • Text utilities
    • Online Lint Tools
search

Chrome developer tools

  • Chrome - copy as cURL
  • Chrome - how to access pre-release features
  • Chrome - useful internal urls (chrome://)
  • Chrome - view javascript errors
  • Edit and debug css in Chrome
  • How to detach Chrome developer tools window
  • View http headers in Chrome
  • clear Chrome HTTP 301 redirect cache
  • custom http request headers
  • how to debug :hover
  • how to debug javascript in Chrome
  • view event handlers in Chrome
 
  • Home
  • > Tutorials
  • > Web Development
  • > Chrome developer tools

how to debug javascript in Chrome

By admin | Last updated on Mar 18, 2016

Chrome developer tools can be used to debug javascript by inserting break point in the javascript code. This is pretty handy to not only debug javascript, but can also be used to understand existing javascript code on a site. Here are steps to debug javascript using chrome developer tools:

  1. We will be using the following code to debug javascript in Chrome:
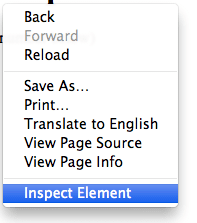
    <!doctype html>
    <html>
    <head>
    <title>Chrome developer tools - debug javascript example</title>
    </head>
    <body>
    <h1>Chrome developer tools - debug javascript example</h1>
    <script type="text/javascript">
    function foo() {
      var a = 10;
      var b = 20;
      var c = a + b;
      var elem = document.getElementById("res");
      var existingVal = parseInt(elem.textContent);
      elem.textContent = existingVal + c;
    }
    </script>
    <a href="" onclick="foo(); return false;">clickme</a> (to add 30 to the number below)
    <div id="res">0</div>
    </body>
    </html>
    
    You can see the live demo at chrome developers tools – debug javascript example.
  2. First open the chrome developer tools by right clicking anywhere on the page and then clicking on inspect element as shown below:
    chrome-right-click-inspect-element
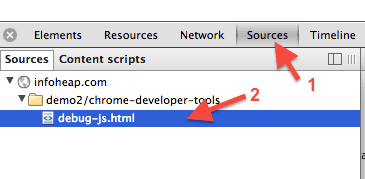
  3. Make sure source tab is selected in the chrome developer tools. Then select the source file containing the javascript code as shown below:
    chrome-developer-tools-source-file
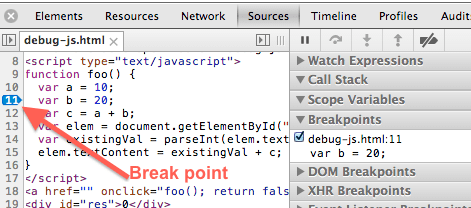
  4. Locate the desired javascript code in the source file and click on the line number to add a breakpoint as shown below:
    chrome-developer-tools-js-code-break-point
  5. Now click on the link clickme in demo page which triggers the code. Here is how the ui looks when the debugger is at a specific break point:
    chrome-developer-tools-in-debug
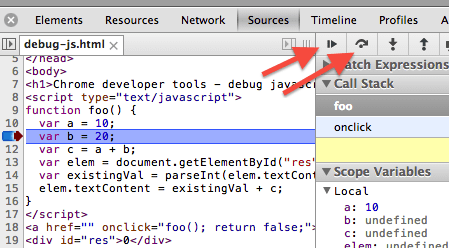
  6. You can click on “step over next function call” icon to run code to next line. In case you want to resume the script, then you can use “resume script execution” icon.

Suggested posts:

  1. Debug javascript using node-inspector, node-debug, nodemon and Chrome
  2. How to detach Chrome developer tools window
  3. Chrome – view javascript errors
  4. Edit and debug css in Chrome
  5. view event handlers in Chrome
  6. How to debug :hover in Chrome
  7. View http headers in Chrome
  8. How to install and run Chrome PageSpeed insights for measuring site performance
Share this article: share on facebook share on linkedin tweet this submit to reddit
Posted in Tutorials | Tagged Chrome developer tools, Javascript, Tutorials

Follow InfoHeap

facebook
twitter
googleplus
  • Browse site
  • Article Topics
  • Article archives
  • Recent Articles
  • Contact Us
  • Omoney
Popular Topics: AngularJS | Apache | AWS and EC2 | Bash shell scripting | Chrome developer tools | CSS | CSS cookbook | CSS properties | CSS Pseudo Classes | CSS selectors | CSS3 | CSS3 flexbox | Devops | Git | HTML | HTML5 | Java | Javascript | Javascript cookbook | Javascript DOM | jQuery | Linux | Linux/Unix Command Line | Mac | Mac Command Line | Mysql | Networking | Node.js | Online Tools | PHP | PHP cookbook | PHP Regex | Python | Python array | Python cookbook | SEO | Site Performance | SSH | Ubuntu Linux | Web Development | Webmaster | Wordpress | Wordpress customization | Wordpress How To | Wordpress Mysql Queries

Copyright © 2022 InfoHeap.

Powered by WordPress