InfoHeap
Tech tutorials, tips, tools and more
Navigation
  • Home
  • Tutorials
    • CSS tutorials & examples
    • CSS properties
    • Javascript cookbook
    • Linux/Unix Command Line
    • Mac
    • PHP
      • PHP functions online
      • PHP regex
    • WordPress
  • Online Tools
    • Text utilities
    • Online Lint Tools
search

Chrome developer tools

  • Chrome - copy as cURL
  • Chrome - how to access pre-release features
  • Chrome - useful internal urls (chrome://)
  • Chrome - view javascript errors
  • Edit and debug css in Chrome
  • How to detach Chrome developer tools window
  • View http headers in Chrome
  • clear Chrome HTTP 301 redirect cache
  • custom http request headers
  • how to debug :hover
  • how to debug javascript in Chrome
  • view event handlers in Chrome
 
  • Home
  • > Tutorials
  • > Web Development
  • > Chrome developer tools

View http headers in Chrome

on Feb 3, 2016

Chrome developer tools can be used to view browser HTTP request and response headers when browser loads a page or makes AJAX calls. Here are steps to view HTTP headers in Chrome.

  1. First open Developer tools in Chrome by clicking on Menu icon > More tools > Developer Tools. You can also use the following shortcuts to open chrome dev tools.
    OS Shortcut
    Mac [Option] + [Command] + I
    Windows [Ctrl] + [Shift] + I

    chrome-menu-developer-tools

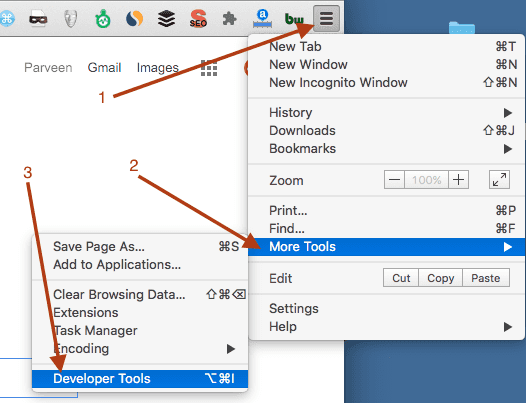
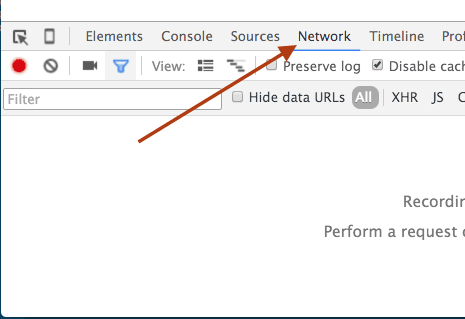
  2. Select the network tab in chrome developers tools.
    chrome-developer-tools-network-tab
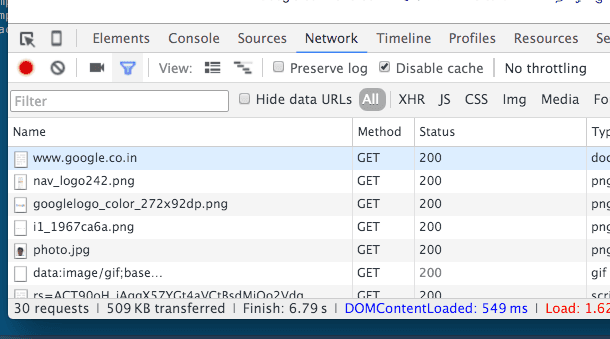
  3. Load the page for which you want to view http request/response headers. You will see list of all requests in network tab in chrome developer tools.chrome-developer-tools-requests-list

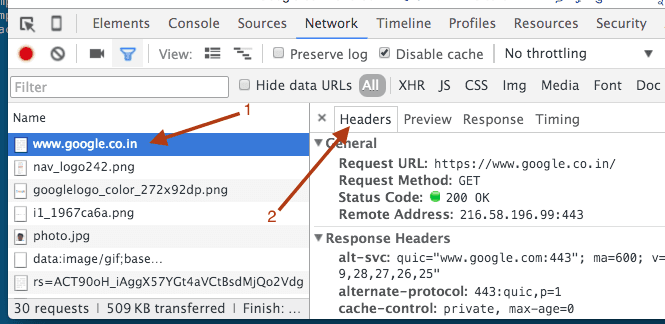
  4. Click on any request to see its request and response headers.
    chrome-developer-tools-one-request-request-response-headers

Suggested posts:

  1. Chrome – how to add custom http request headers
  2. How to detach Chrome developer tools window
  3. How to clear Chrome HTTP 301 redirect cache
  4. view event handlers in Chrome
  5. Edit and debug css in Chrome
  6. Chrome – view javascript errors
  7. How to install and run Chrome PageSpeed insights for measuring site performance
  8. how to debug javascript in Chrome
Share this article: share on facebook share on linkedin tweet this submit to reddit
Posted in Tutorials | Tagged Chrome developer tools, Mac, Tutorials, Web Development, Windows

Follow InfoHeap

facebook
twitter
googleplus
  • Browse site
  • Article Topics
  • Article archives
  • Recent Articles
  • Contact Us
  • Omoney
Popular Topics: Android Development | AngularJS | Apache | AWS and EC2 | Bash shell scripting | Chrome developer tools | CSS | CSS cookbook | CSS properties | CSS Pseudo Classes | CSS selectors | CSS3 | CSS3 flexbox | Devops | Git | HTML | HTML5 | Java | Javascript | Javascript cookbook | Javascript DOM | jQuery | Kubernetes | Linux | Linux/Unix Command Line | Mac | Mac Command Line | Mysql | Networking | Node.js | Online Tools | PHP | PHP cookbook | PHP Regex | Python | Python array | Python cookbook | SEO | Site Performance | SSH | Ubuntu Linux | Web Development | Webmaster | Wordpress | Wordpress customization | Wordpress How To | Wordpress Mysql Queries

Copyright © 2023 InfoHeap.

Powered by WordPress