InfoHeap
Tech tutorials, tips, tools and more
Navigation
  • Home
  • Tutorials
    • CSS tutorials & examples
    • CSS properties
    • Javascript cookbook
    • Linux/Unix Command Line
    • Mac
    • PHP
      • PHP functions online
      • PHP regex
    • WordPress
  • Online Tools
    • Text utilities
    • Online Lint Tools
search

Chrome developer tools

  • Chrome - copy as cURL
  • Chrome - how to access pre-release features
  • Chrome - useful internal urls (chrome://)
  • Chrome - view javascript errors
  • Edit and debug css in Chrome
  • How to detach Chrome developer tools window
  • View http headers in Chrome
  • clear Chrome HTTP 301 redirect cache
  • custom http request headers
  • how to debug :hover
  • how to debug javascript in Chrome
  • view event handlers in Chrome
 
  • Home
  • > Tutorials
  • > Web Development
  • > Chrome developer tools

Chrome – view javascript errors

on Mar 31, 2016

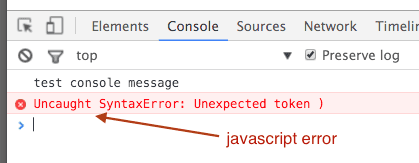
It is useful to view Javascript errors in Chrome for debugging purpose. Chrome developer tools console can be used to view Javascript errors as shown below:
chrome-developer-tools-console-javascript-errors

One drawback of this approach is that it requires opening chrome developer tools whenever we want to view errors. A better approach is to use Chrome extension Javascript errors notifier. This extension surfaces javascript errors automatically using an error indicator. Here are quick steps on how to use the extension.

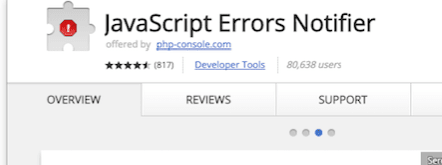
  1. Install the Javascript errors notifier extension in Chrome
    chrome-javascript-error-notifier-extension

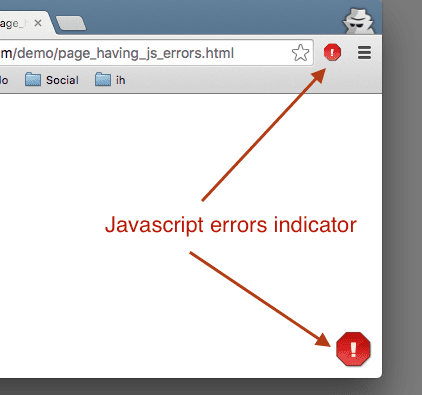
  2. Visit a page having Javascript errors. You should be able to see the error indicator (browser toolbar) and error notification icon (page bottom right corner) as shown below:

    chrome-javascript-error-notifier-errors-indicator

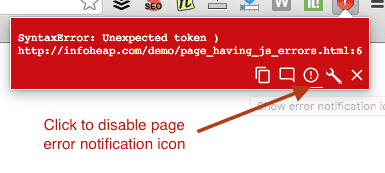
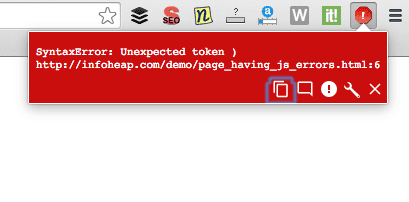
  3. To get detailed error message click on toolbar error indicator.
    chrome-javascript-error-notifier-detailed-errors

  4. You can also switch off page notification icon using the option to toggle errors notification icon as shown below.
    chrome-javascript-errors-notofoer-option-to-disable-page-error-icon

Suggested posts:

  1. view event handlers in Chrome
  2. View http headers in Chrome
  3. how to debug javascript in Chrome
  4. How to detach Chrome developer tools window
  5. How to install and run Chrome PageSpeed insights for measuring site performance
  6. Javascript – catch errors using window.onerror
  7. Chrome extension tutorial – access active page dom
  8. Chrome extension tutorial – hello world
Share this article: share on facebook share on linkedin tweet this submit to reddit
Posted in Tutorials | Tagged Chrome developer tools, Javascript, Tutorials, Web Development

Follow InfoHeap

facebook
twitter
googleplus
  • Browse site
  • Article Topics
  • Article archives
  • Recent Articles
  • Contact Us
  • Omoney
Popular Topics: Android Development | AngularJS | Apache | AWS and EC2 | Bash shell scripting | Chrome developer tools | CSS | CSS cookbook | CSS properties | CSS Pseudo Classes | CSS selectors | CSS3 | CSS3 flexbox | Devops | Git | HTML | HTML5 | Java | Javascript | Javascript cookbook | Javascript DOM | jQuery | Kubernetes | Linux | Linux/Unix Command Line | Mac | Mac Command Line | Mysql | Networking | Node.js | Online Tools | PHP | PHP cookbook | PHP Regex | Python | Python array | Python cookbook | SEO | Site Performance | SSH | Ubuntu Linux | Web Development | Webmaster | Wordpress | Wordpress customization | Wordpress How To | Wordpress Mysql Queries

Copyright © 2023 InfoHeap.

Powered by WordPress